To act quickly on website downtime, you need to be proactive and create a website uptime monitor. This 15-minute no-code workshop will show you how to create an uptime monitor in Flowlet. It is a quick and educative example of what you can do with Flowlet.
Why use Flowlet to create an uptime monitor?
Flowlet is not a monitoring tool in itself and hence doesn't ship with all the features you would expect from an uptime monitor. However, with Flowlet, you can no-code your custom logic and automate various responses. Perform further checks or even reboot your server automatically.
What will we build
This blog shows a minimal working example of a no-code uptime monitor. You can add multiple URLs that are pinged every 5 minutes. That's it, but we will give directions for extensions to this system.
Collection of monitored websites
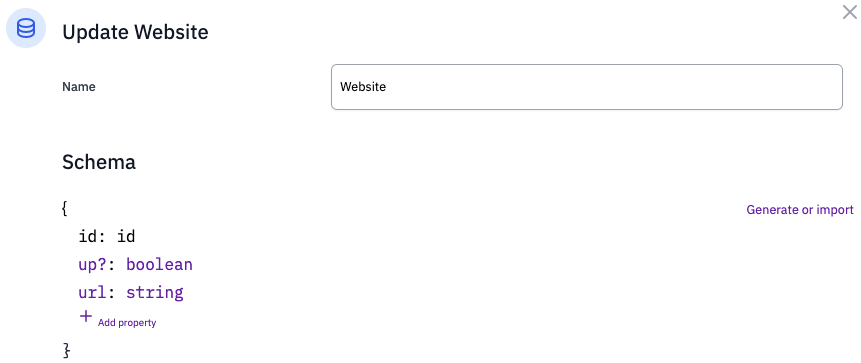
In your Flowlet workspace, you can access the data collections using the "Data” button in the menu. Use the "Add table” button to create a new collection. Give it the name "Website” and click the "Generate or import” link to generate the structure from the following JSON:
{
  "id": "FzBg32...",
  "url": "https://example.com"
}
Then click the "up” label and uncheck the "required” checkbox. When adding new records, we don't know their status yet. The final schema should match the screenshot below.
Once we have the collection, we will need to add each URL as a separate entry. Click the plus sign (top left of the table) to add a new row. Fill in a URL and hit the checkmark to save the record. To test if the service is working, you may include URLs from services like httpstat.us to simulate broken sites.
No-code automated task to update status
The next step is to no-code an automated task that checks each site in the collection for viability. Add a new flow of the "Automated task” type. Then, open the configuration of the start block. Change its name to something meaningful, like "Ping sites”, and set the minute to "every 5 minutes”. Now, you're all set to build the core of this project; test each site.
The steps for the fundamental process are as follows:
- Get the list of sites to test.
- Loop through this list.
- Perform an HTTP request. We check the status code that comes back. It should be in the range of 200 to 399. Anything else indicates an error.
- Check if the status is different from the status that is currently stored in our database.
- If the status changes, update the database and send a notification.
The completed flow looks like this:
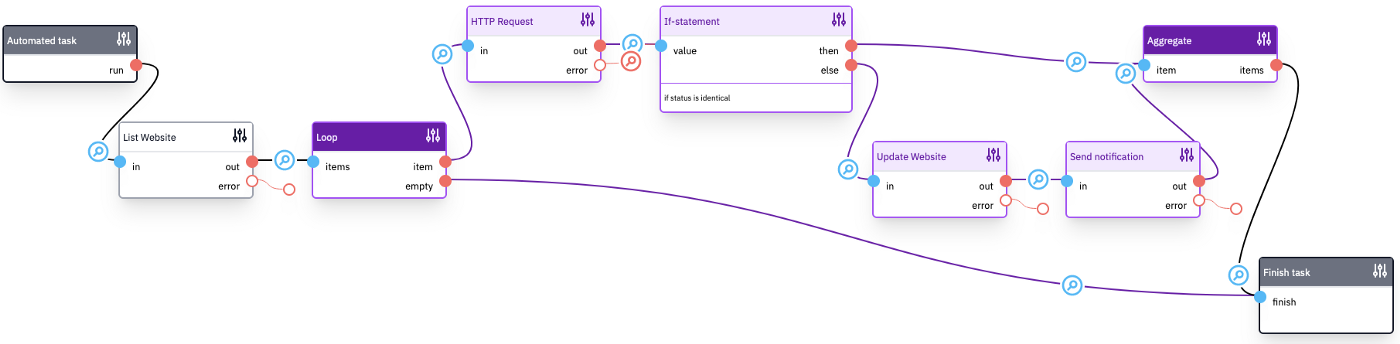
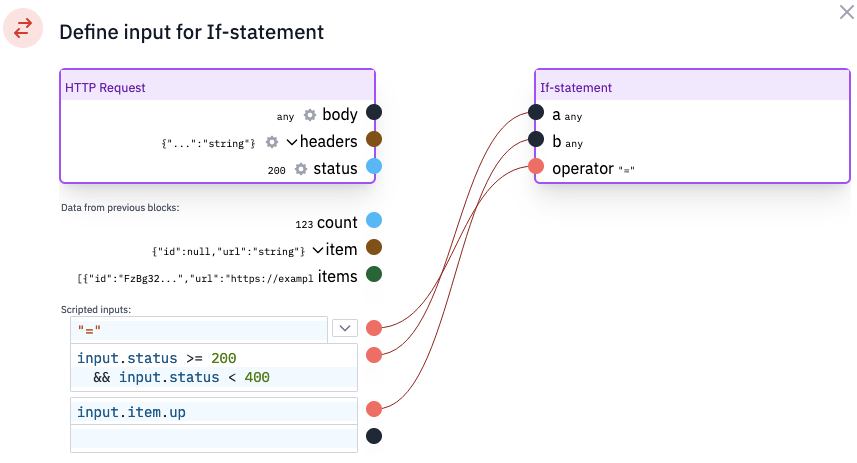
We've used a single if-statement for the fourth step. However, the condition is made up of multiple conditions (status >= 200, status < 400, and not equal to the current stored status). To accomplish this, we can use TypeScript in the mapping dialog, as visible in the screenshot below.
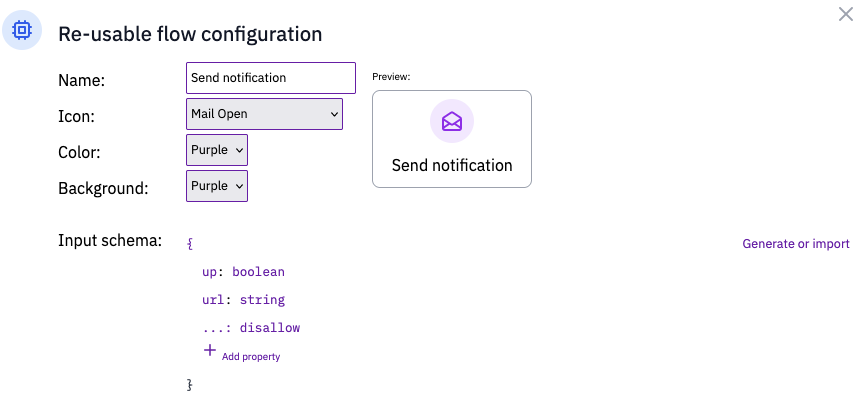
Further down the flow is the "Send notification” flow, which needs some explanation. This block was created as a reusable flow. You can create blocks this way, which is often a convenient method to build isolated parts that you might want to reuse or change later. In this case, we don't have to touch this automated job when we want to send notifications over another channel. The only relevant detail is the input schema for this block, which you can configure in the start block of the "Send notification” flow.
When you have this flow, you're already done with the core of our no-code app. It will detect when one of the configured sites goes down! Yet, we'll likely want some extensions.
Sending notifications
In our example, we use internal logging to store notifications when a site goes down or up. That is great for testing our uptime monitor, but you likely want to send messages elsewhere.
You can send notifications by mail using the mail block. For this, you need to bring your SMTP server, which could be a gmail smtp server or a service like Mailgun. It sounds simple, but mail might take some time to set up correctly due to security concerns and anti-spam measures.
Another possible target is Slack. They used to have a feature called "Incoming webhooks” that allowed you to do this with ease. However, that feature is deprecated, and you'll need a full-fledged OAuth2 integration. You can read our blog on creating Slack apps in Flowlet.
An app that is specialized in sending emergency notifications is PagerDuty. Please read our blog on Emergency Response Flow for more information on this integration.
Adding user accounts and authentication
You can combine this application with the OpenID IdP template to provide user login and authorization. The login is implemented by installing the template and adding the OpenID secret, as you can read in the linked blog. To connect it with the uptime monitor, add a column to the Websites collection named "user”. Use the "id” type and configure it to refer to the User collection (which comes from the OpenID IdP template).
Some REST API endpoints are needed to allow users to manage their websites. These can use the "openid” secret for authentication. If you do so, the HTTP endpoint flow automatically has the user id available (from the JWT payload), which you can use in the CRUD blocks to list the user's websites, or link a new website to the user's account.
Get started on your uptime monitor
In under 15 minutes, you can create a website uptime monitor in Flowlet. By following the simple steps in this workshop, you'll be able to keep track of your website's uptime, so you can take action quickly if there are any issues. Flowlet allows you to extend this concept as you please, whether you want to take automated steps when a site goes down or want to provide this functionality to other users over an API.
Can't wait to write APIs with Flowlet?
- Get started with a 7-day trial
- Follow us on Medium, Twitter, or LinkedIn