Website outages can happen anytime, but how do you ensure that your customer can reach out and receive a timely response in an emergency? In this blog, I'll explain how we used Flowlet to set up an emergency response flow to get notified of downtime, respond to the client, and take appropriate steps to fix it.

Introduction and background
Websites are a critical part of most businesses today. Given the importance of websites, it's essential to have a plan for dealing with downtime. One way to do this is to create an emergency response flow for website uptime monitoring. This type of flow can be used to send notifications and automatically detect issues with your website. There are many different ways to set up such a flow, but one approach is to use Flowlet. Flowlet is a low-code tool that allows you to create and manage data flows easily.
The flow starts with an ‘emergency button' pushed by the customer or an automated message from an uptime monitoring service. The emergency signal is sent to mobile phones with the PagerDuty app because it allows us to ring the bell even when the do-not-disturb mode is on. Additionally, a quick scan is carried out to check the availability of each part of the system. Its target is twofold; give us a quick status overview to shorten response times and provide the client with an automated estimate of the expected duration.
The application described is pretty extensive for a blog post. Hence it's not described in full detail but will give you some leads to get started on your own escalation process.
Setting up the process
If you do not already have one, create a Flowlet account to get started. In Flowlet, each part of the system is a small flow, for example, a REST-endpoint or cronjob. In this example, we'll create a handful of HTTP endpoints and a few additional re-usable flows to use in these endpoints. A re-usable flow defines a block to be used in other flows to execute a stand-alone task, for example, sending a notification via PagerDuty.
Connecting to PagerDuty
We connect our process to PagerDuty to ensure that someone is always on call in an emergency. The steps to set up PagerDuty are straightforward. Install the app, add a service, and configure the "Default escalation policy”. To send a notification from Flowlet, we need the following details:
Your username This is the email address you used to sign up.
API Access token You can find "API Access Keys” under "Integrations”. Create a new PagerDuty API key.
Service ID Go to the service in your PagerDuty account. You will find the ID in the URL, which will look like "*.pagerduty.com/service-directory/PGEGZ3Z", where "PGEGZ3Z” is the part we need.
When you have these details, go to Flowlet to add a new re-usable flow. Click the configure button of the start block and give it the name "Send PagerDuty'. Generate the input from the following JSON:
{ "token”: "”, "username”: "info@example.com”, "serviceId”: "”, "message”: "” }
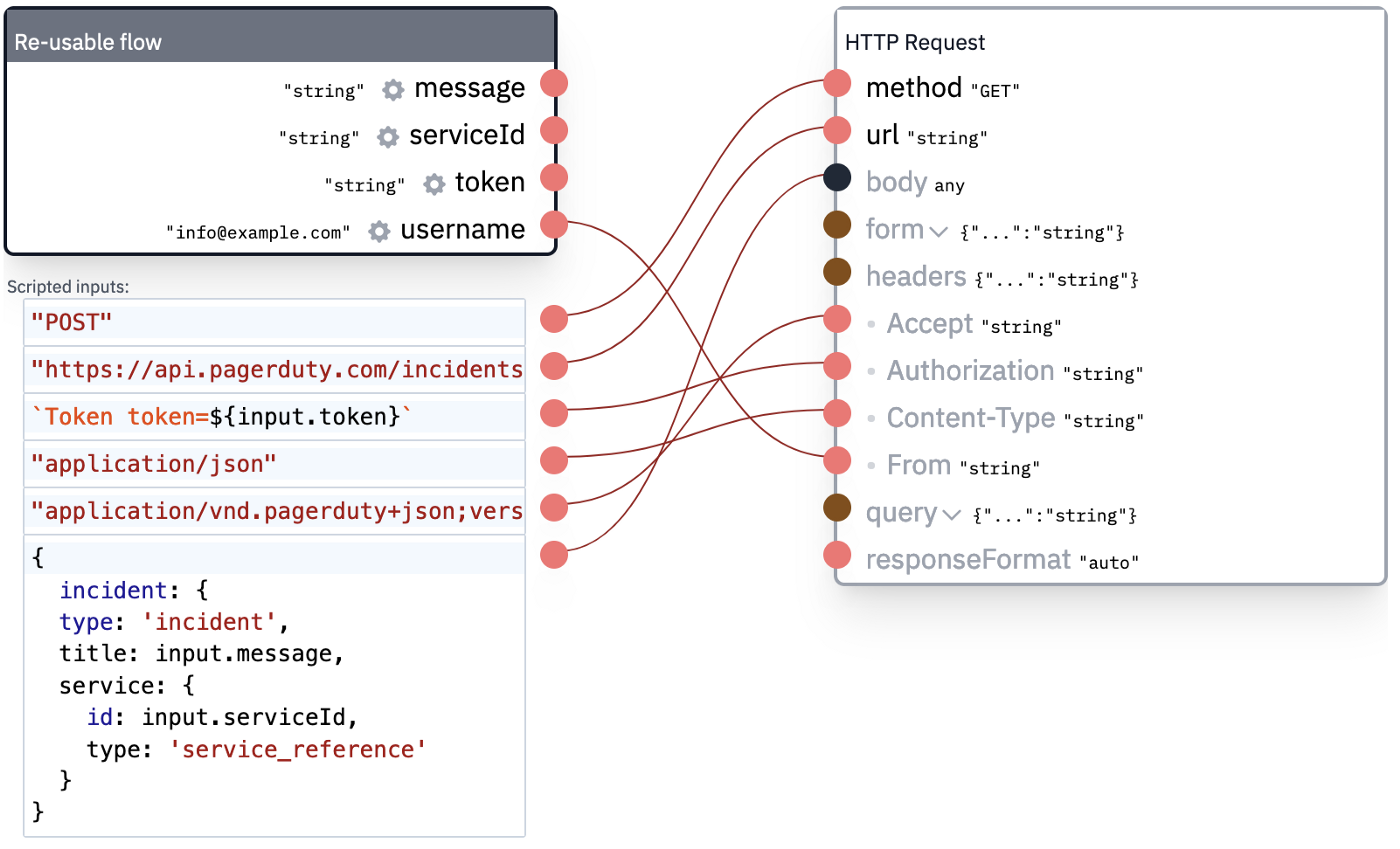
To send a notification via PagerDuty, we need their incident creation api. Connect that block's "in” pin to a new "HTTP Request” block. Configure this block to use method "POST” and URL "https://api.pagerduty.com/incidents". Furthermore, their API requires all calls to include the following headers:
Token token=TOKEN Content-Type: application/json Accept: application/vnd.pagerduty+json;version=2
We can use the code fields for that, where the token can include the flow input using this code:
`Token token=${input.token}`
Lastly, set the body to
{ incident: { type: ‘incident', title: input.message, service: { id: input.serviceId, type: ‘service_reference' } }
The completed mapping should look like the screenshot below:
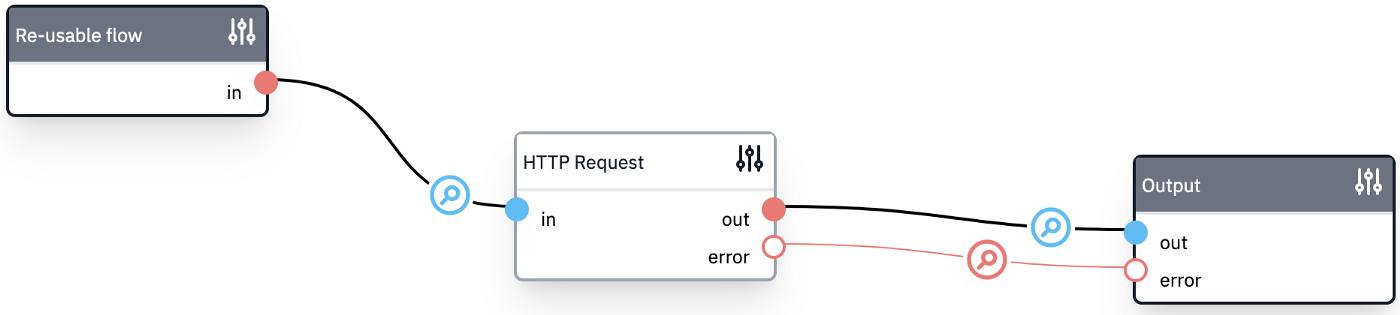
To finalize the flow, connect the "out” and "error” pins of the HTTP request to the flow's output pins. Then hit the "Test flow” button to test this notification method.
Connecting to Mailgun for email notifications
We want to keep the customer up-to-date with mail notifications during the escalation. Sending mail, however, needs some attention to prevent hitting the spam folder. In this example, we'll use Mailgun to ensure that we have a reliable facility for sending mail. Its setup requires a domain name for which you can set DNS records.
If you have your domain configured in Mailgun, go to "Sending”, "Domain settings”, "SMTP credentials”, and make sure you are at the correct domain (using the dropdown on the top of the page). This is visible in the screenshot below.
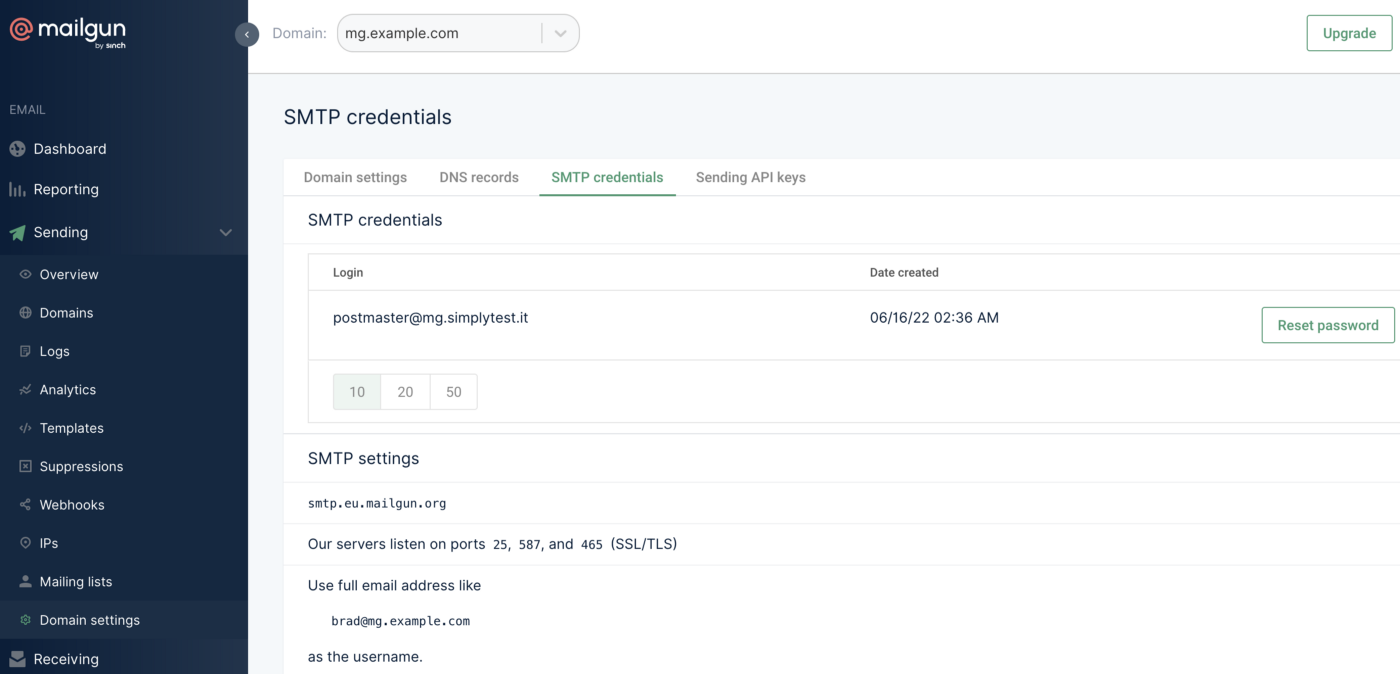
Unlike their explanation, brad@mg.example.com is rejected as a username. You must use the exact address shown in the table (postmaster@mg.example.com). Click the "Reset password” button to generate a new password.
In Flowlet, create a re-usable flow, as we did for PagerDuty. Give it the name "Send Mail” and generate the input using the following code:
{ "subject”: "”, "body”: "” }
Then add the block "Script” and use the following:
export async function script1({subject, body}: { subject: string; body: string; }): Promise<{}> { const server = ‘smtps://postmaster%40mg.example.com:PASSWORD@smtp.mailgun.org'; await mail.send(server, ‘monitoring@mg.example.com', ‘your-mail@example.com', subject, body, false); return {}; }
Note that the username is URL encoded here, hence the "%40" in "postmaster%40mg.example.com". Also, replace your password and mail address. When using Mailgun's EU instance, use "smtp.eu.mailgun.org” instead of "smtp.mailgun.org”.
Create the emergency button
Although Flowlet is not a page builder, we can use an API route for this simple use case. Create a REST-endpoint on the path "/API/emergency-button”. The Tailwind Playground is a quick way to create a styled page for this. If it looks good, wrap it inside backticks and map it to the flow output.
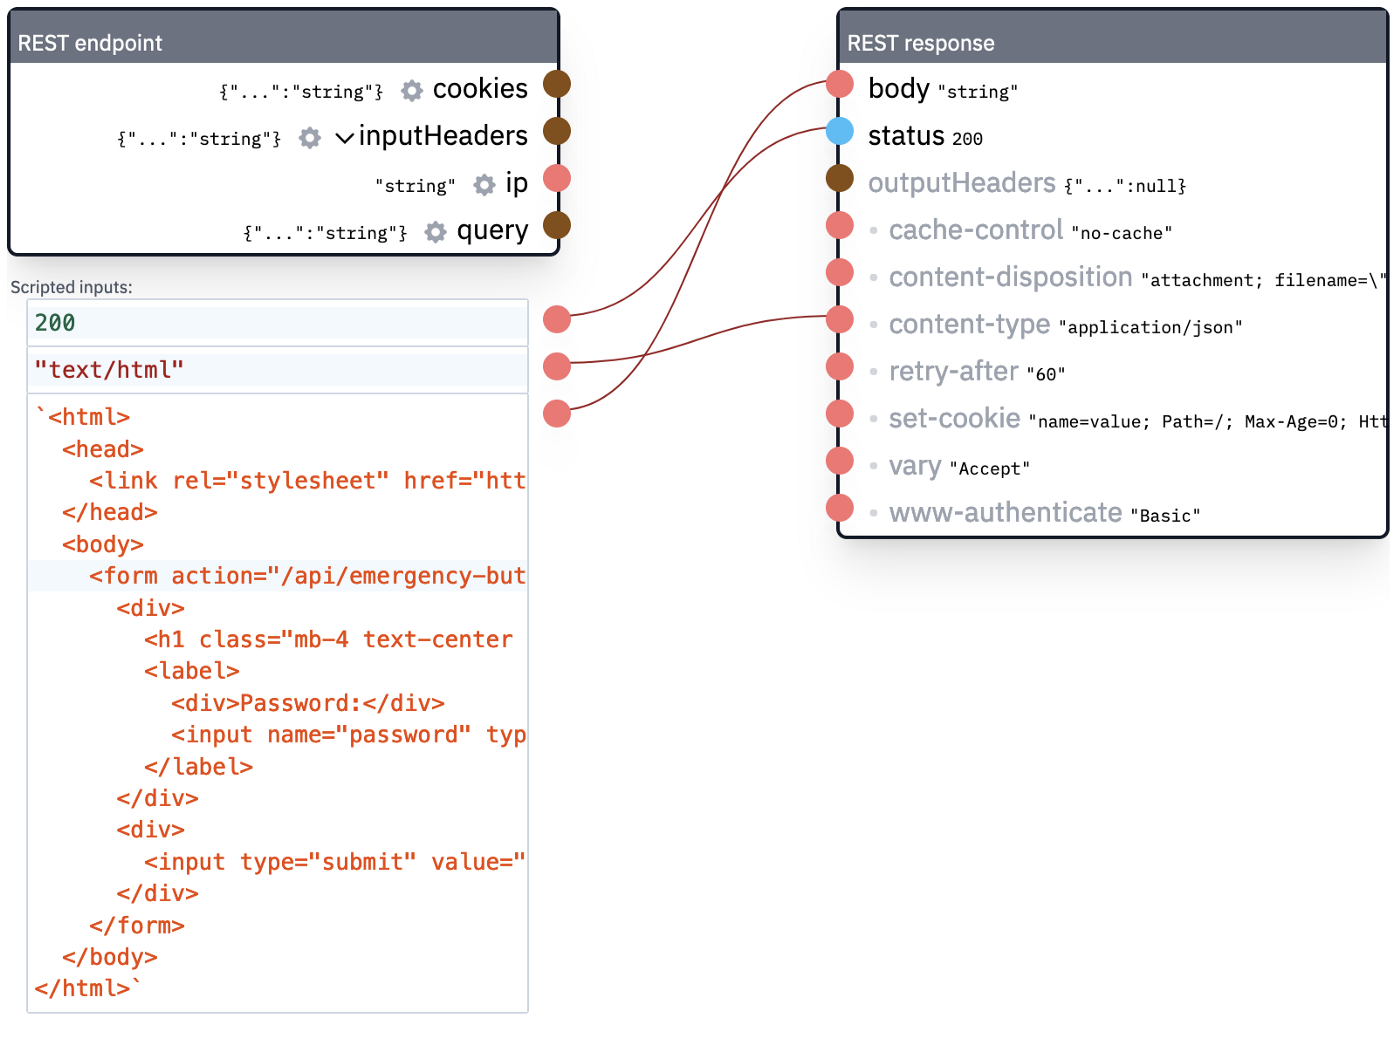
Additionally, we need a REST-endpoint on "POST /API/emergency-button” to process the form submission.
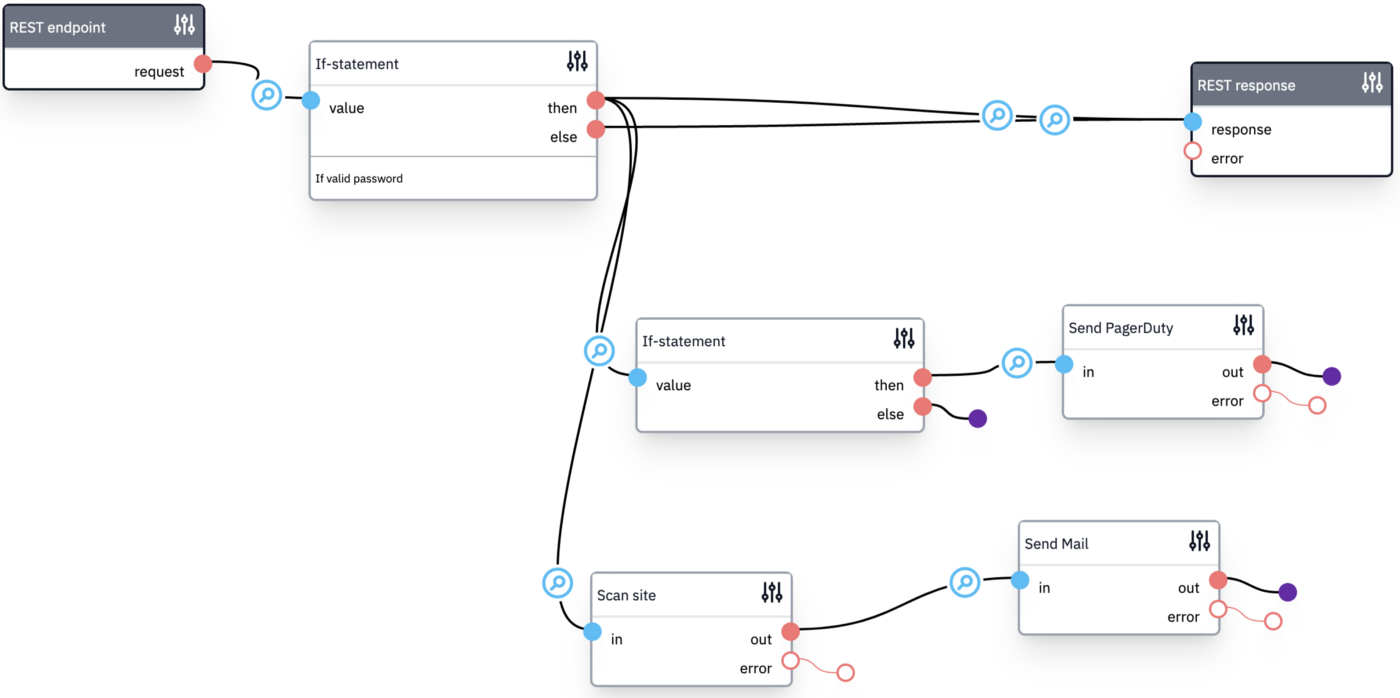
The flow above starts by checking the password. We can directly return an error when it's incorrect. Otherwise, we'll continue sending the notification. Also, we can execute a quick scan. This is an extension of the flow, which we'll describe later.
Retrieving webhooks from PagerDuty and NodePing
When your website or application goes down, you want to be the first to know. That's why you need an uptime monitoring solution in place. NodePing is a simple service that can be used for this. Both NodePing and PagerDuty can send webhooks to our Flowlet workspace.
Retrieving a webhook can be done with a simple REST-endpoint, for example, on "GET /pagerduty-webhook”. We will use this webhook to send mails to a global inbox for logging when an emergency signal is sent or acknowledged. The latter is triggered when you click the "Acknowledge” button in PagerDuty's push notification. It is convenient to send a mail to the customer that reads like "Emergency signal acknowledged by ${input.requestBody.event.agent.summary}”, so (s)he knows who is working on this incident.
We can process the NodePing webhook in a similar way. Also, you can add additional steps to your flow, such as opening a ticket.
Creating a Quickscan to automate diagnostics
Being notified is nice, but it is better to have already an automated check running as soon as issues arise. Flowlet supports various functions that we can use to compose a quick test, including DNS lookups and analyzing HTTP responses.
To create a quick scan, we'll create a new re-usable flow named "Scan site”, similar to the one below:
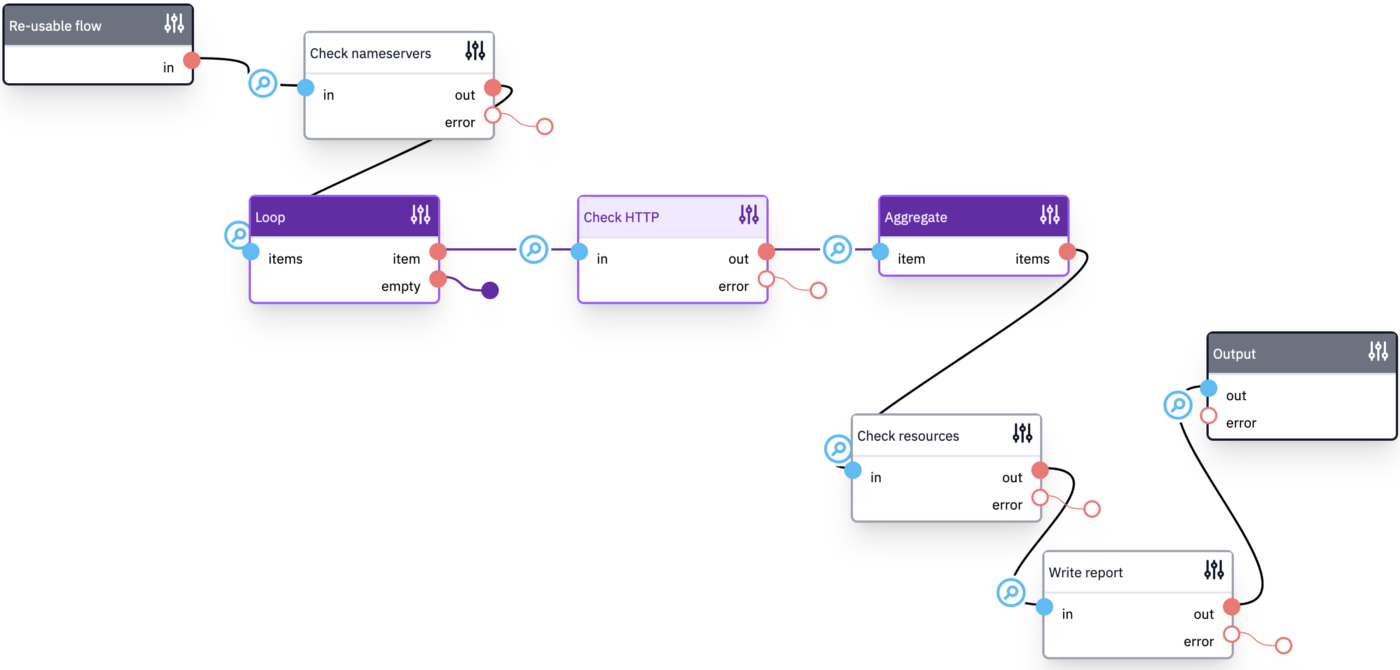
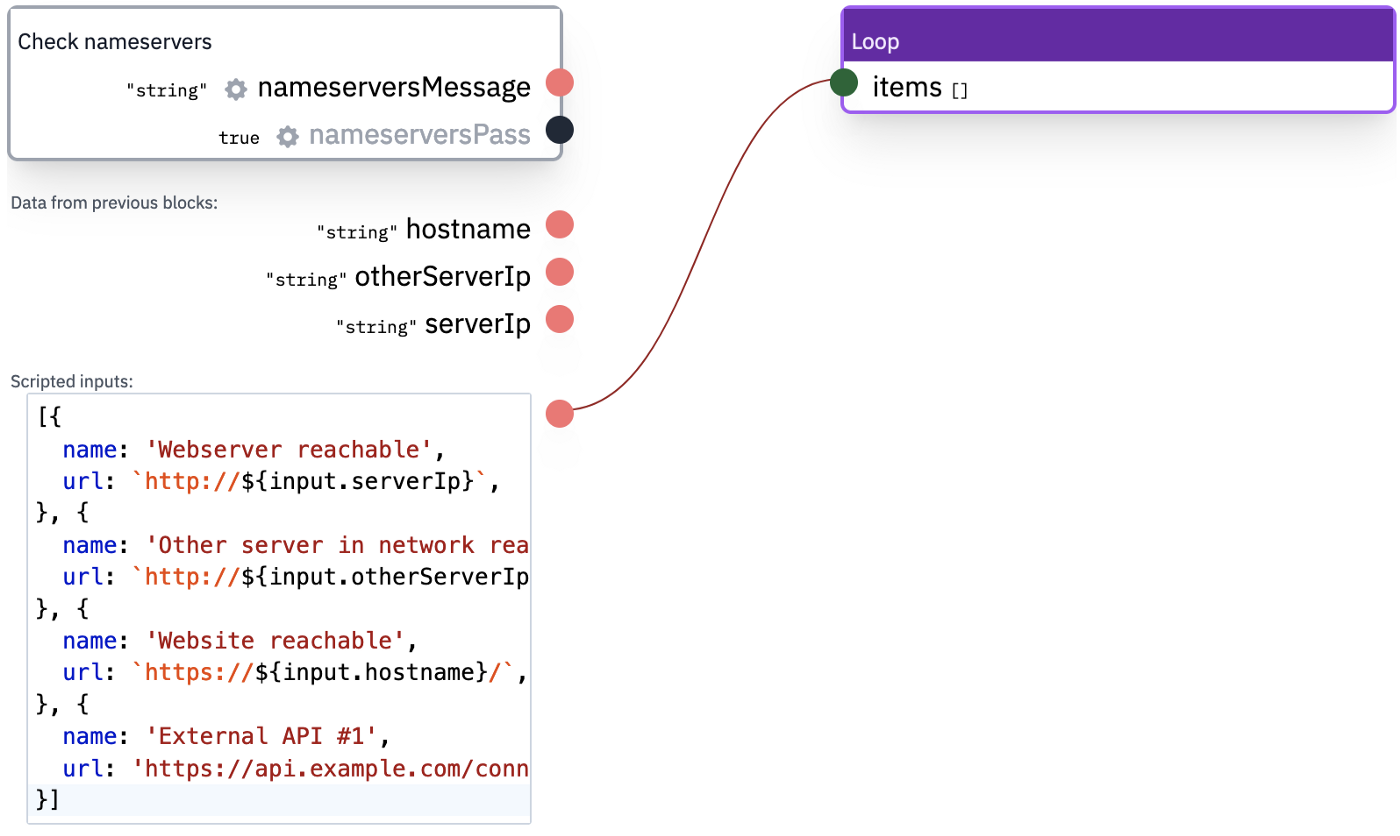
The "Check nameservers” block is a script to test the configured nameservers. The "Check HTTP” block contains a script to check HTTP endpoints. Interestingly, we've enclosed this in a loop to quickly scan multiple endpoints, as shown below.
You might use external monitoring tools to assess the resource usage on your server. If you do not have any, you may also use a simple crontab to write this data to a text file, preferably every minute.
cat /proc/loadavg > /var/www/html/quickscan-data/load.txt free -m | grep Mem > /var/www/html/quickscan-data/memory.txt
Then use a Flowlet script to fetch these files and parse the data.
To finalize the quick scan, use a script to aggregate the results in a textual format suitable for sending per mail.
Conclusion
When the most critical web application goes down, we first want to assess the situation and determine what caused the problem. A quick scan can help us do this automatically, and Flowlet makes it easy to set up. The outline described in this post can be extended with other channels, such as Slack and SMS. Furthermore, you can code your own checks to automate the initial diagnostics. So next time your site goes down, you'll be prepared!